LATEST MEASUREMENT:
April 2023
98 (± 4.0) mm
This is the “uncertainty margin,” or the range from the mean (average) within which there is a high probability that the true number resides. For example, when we say global sea level has risen 101 mm +/- 4 mm, the true value has a high probability of being between 97 and 105 mm. The uncertainty margin exists both because of sea level variability (sea level above the first point in the time series) in the ocean and the accuracy with which we measure the individual values.
Sea level rise is caused primarily by two factors related to global warming: the added water from melting ice sheets and glaciers, and the expansion of seawater as it warms. The first graph tracks the change in global sea level since 1993, as observed by satellites.
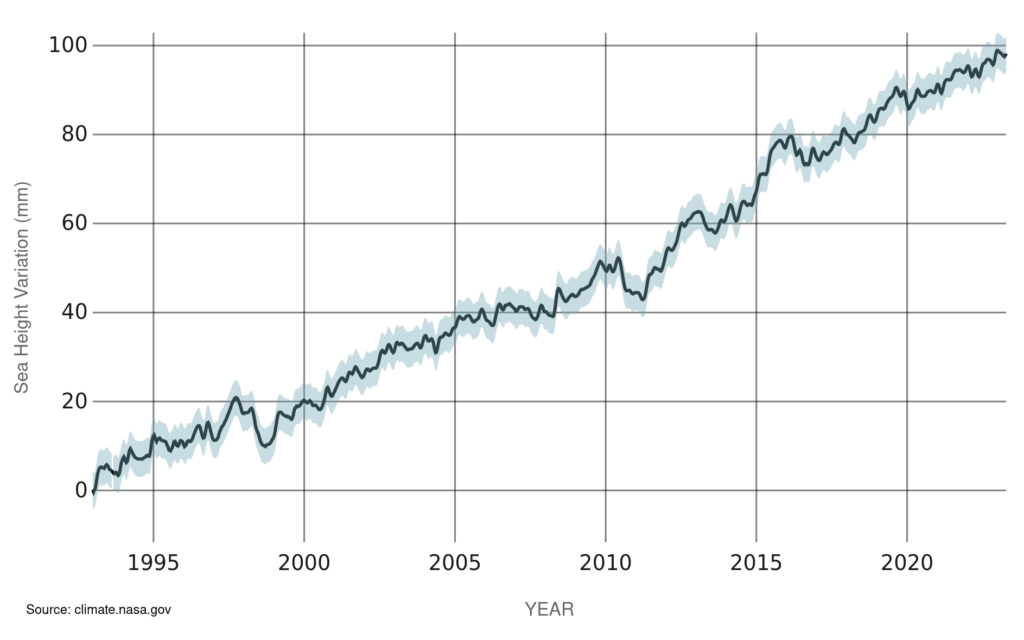
SATELLITE DATA: 1993-PRESENT
Data source: Satellite sea level observations.
Credit: NASA’s Goddard Space Flight Center
The second graph, which is from coastal tide gauge and satellite data, shows how much sea level changed from about 1900 to 2018. Items with pluses (+) are factors that cause global sea level to increase, while minuses (-) are what cause sea level to decrease. These items are displayed at the time they were affecting sea level.
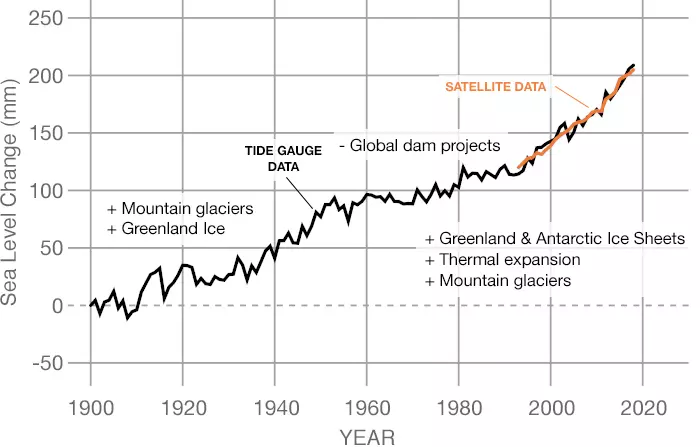
SOURCE DATA: 1900-2018
Data source: Frederikse et al. (2020)
Credit: NASA’s Goddard Space Flight Center/PO.DAAC