Ocean Warming
LATEST MEASUREMENT:
December 2022
345 (± 2) zettajoules From 1955
The “(±X)” figure is the “uncertainty margin,” or the range from the mean (average) within which there is a high probability that the true number resides. For example, when we say that ocean heat content for a particular year is 220 +/- 2 zettajoules, the true value for that year has a high probability of being between 218 and 222 zettajoules. The uncertainty margin exists both because of:
- natural variability (some years, more heat goes into the ocean, other years, less so; some years, more energy goes increasingly deeper in the ocean, and other years, more of it stays closer to the surface)
- how accurately available instruments are able to measure ocean heat; this has substantially improved over time
Ninety percent of global warming is occurring in the ocean, causing the water’s internal heat to increase since modern recordkeeping began in 1955, as shown in the upper chart. (The shaded blue region indicates the 95% margin of uncertainty.) This chart shows annual estimates for the first 2,000 meters of ocean depth.
Each data point in the upper chart represents a five-year average. For example, the 2020 value represents the average change in ocean heat content (since 1955) for the years 2018 up to and including 2022.
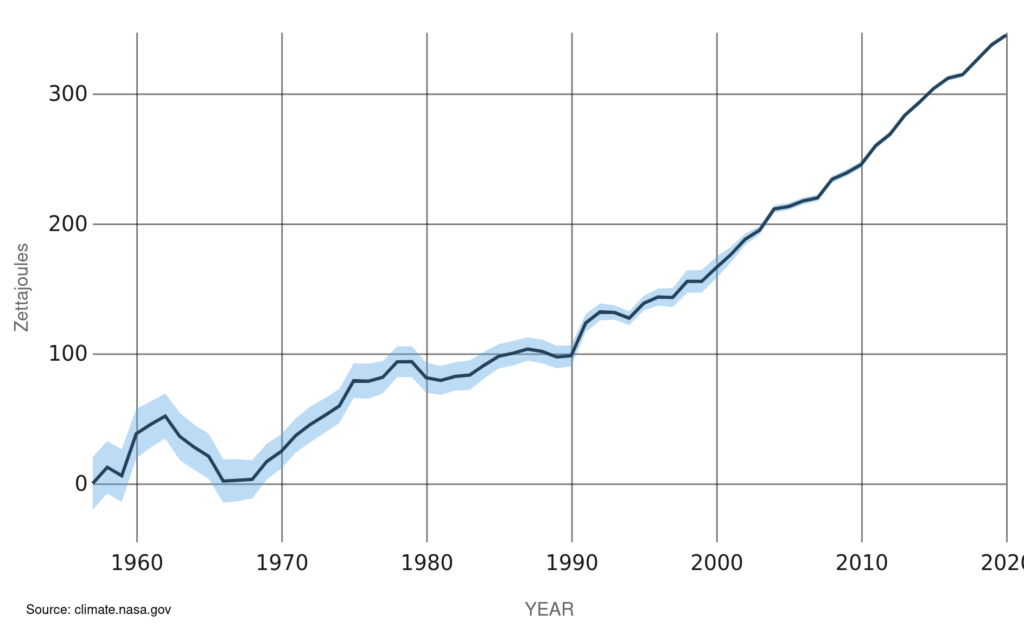
OCEAN HEAT CONTENT CHANGES SINCE 1955 (NOAA)
Data source: Observations from various ocean measurement devices, including conductivity-temperature-depth instruments (CTDs), Argo profiling floats, and eXpendable BathyThermographs (XBTs). Credit: NOAA/NCEI World Ocean Database
The lower chart tracks monthly changes in ocean heat content for the entire water column (from the top to the bottom of the ocean) from 1992 to 2019, integrating observations from satellites, in-water instruments, and computer models. Both charts are expressed in zettajoules.
Heat stored in the ocean causes its water to expand, which is responsible for one-third to one-half of global sea level rise. Most of the added energy is stored at the surface, at a depth of zero to 700 meters. The last 10 years were the ocean’s warmest decade since at least the 1800s. The year 2022 was the ocean’s warmest recorded year and saw the highest global sea level.
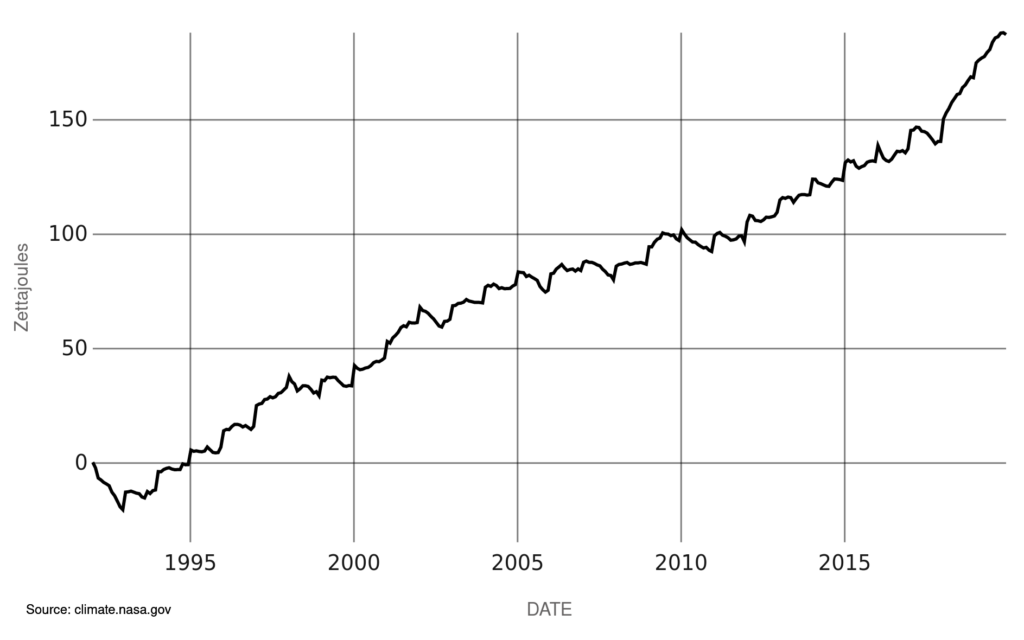
OCEAN HEAT CONTENT CHANGES SINCE 1992 (NASA)
Data source: Observations from satellites and various ocean measurement devices, including conductivity-temperature-depth instruments (CTDs), Argo profiling floats, eXpendable BathyThermographs (XBTs), instrumented mooring arrays, and ice-tethered profilers (ITPs). Credit: NASA ECCO